CPE
Common Platform Enumeration (CPE) is a structured naming scheme for information technology systems, software, and packages. Based upon the generic syntax for Uniform Resource Identifiers (URI), CPE includes a formal name format, a method for checking names against a system, and a description format for binding text and tests to a name. This method of naming is known as a well-formed CPE name (WFN)
source: cpe.mitre.org/specification
You can see this notebook directly via:
Generation time
[1]:
from datetime import datetime, timezone, timedelta

timezone_offset = 0.0
tzinfo = timezone(timedelta(hours=timezone_offset))
generation_time = datetime.now(tzinfo).strftime('%Y-%m-%d %H:%M:%S %z')
print(generation_time)
2026-05-10 16:53:17 +0000
Creative Commons
This notebook and generated diagrams are released with Creative Commons liecense (CC BY 4.0).

[2]:
import requests
import urllib3

urllib3.disable_warnings()

urls = ['https://mirrors.creativecommons.org/presskit/icons/cc.xlarge.png',
       'https://mirrors.creativecommons.org/presskit/icons/by.xlarge.png']
for url in urls:
    file_name = url.split("/")[-1:][0]
    print(file_name)

    file = requests.get(url, verify=False)
    open(file_name, 'wb').write(file.content)
cc.xlarge.png
by.xlarge.png
CPE data downloading
All CPE stats are taken from nvd.nist.gov/products/cpe/statistics
[3]:
import requests
from bs4 import BeautifulSoup, SoupStrainer

def get_data_with_requests(url):
    headers = {
        "User-Agent": "Mozilla/5.0 (Macintosh; Intel Mac OS X 10_15_7) AppleWebKit/537.36 (KHTML, like Gecko) Chrome/91.0.4472.124 Safari/537.36"
    }
    response = requests.get(url, headers=headers)
    response.raise_for_status()
    product = SoupStrainer('table')
    soup = BeautifulSoup(response.text, "html.parser", parse_only=product)
    return soup

url = "https://nvd.nist.gov/products/cpe/statistics"
try:
    data = get_data_with_requests(url)
    print("Data fetched successfully.")
    print(len(data))
except requests.exceptions.RequestException as e:
    print(f"Request failed: {e}")
Data fetched successfully.
18
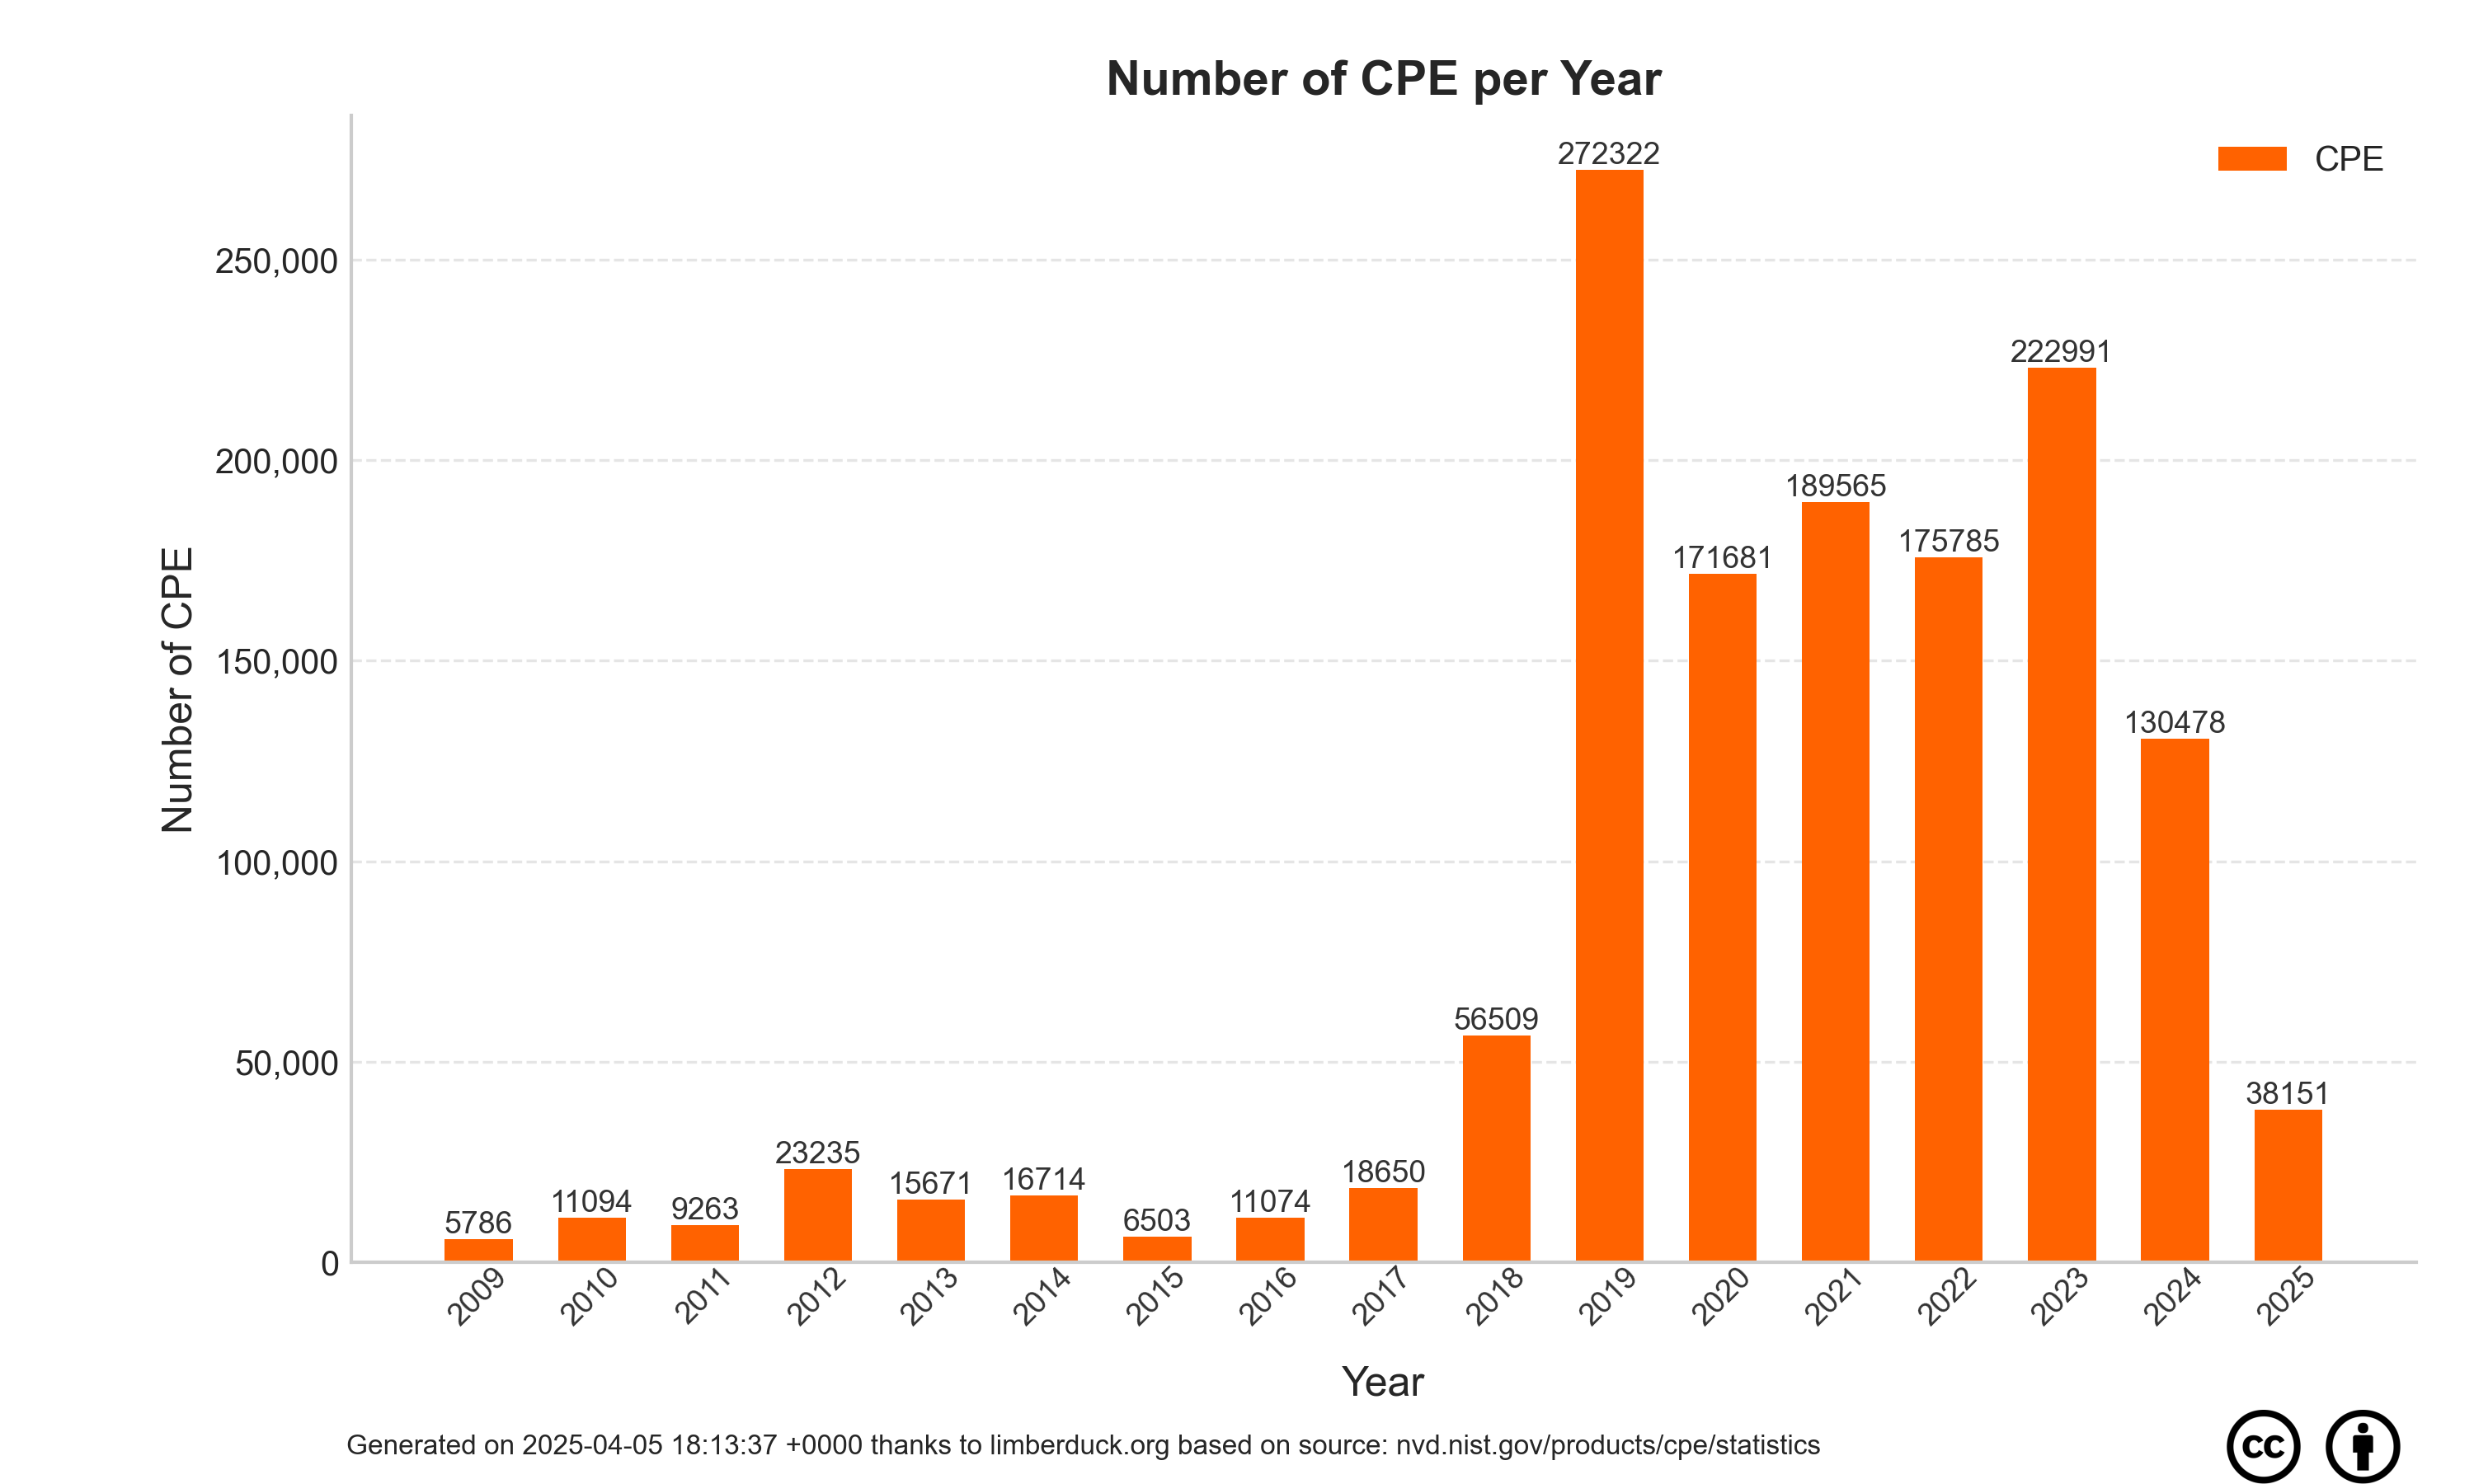
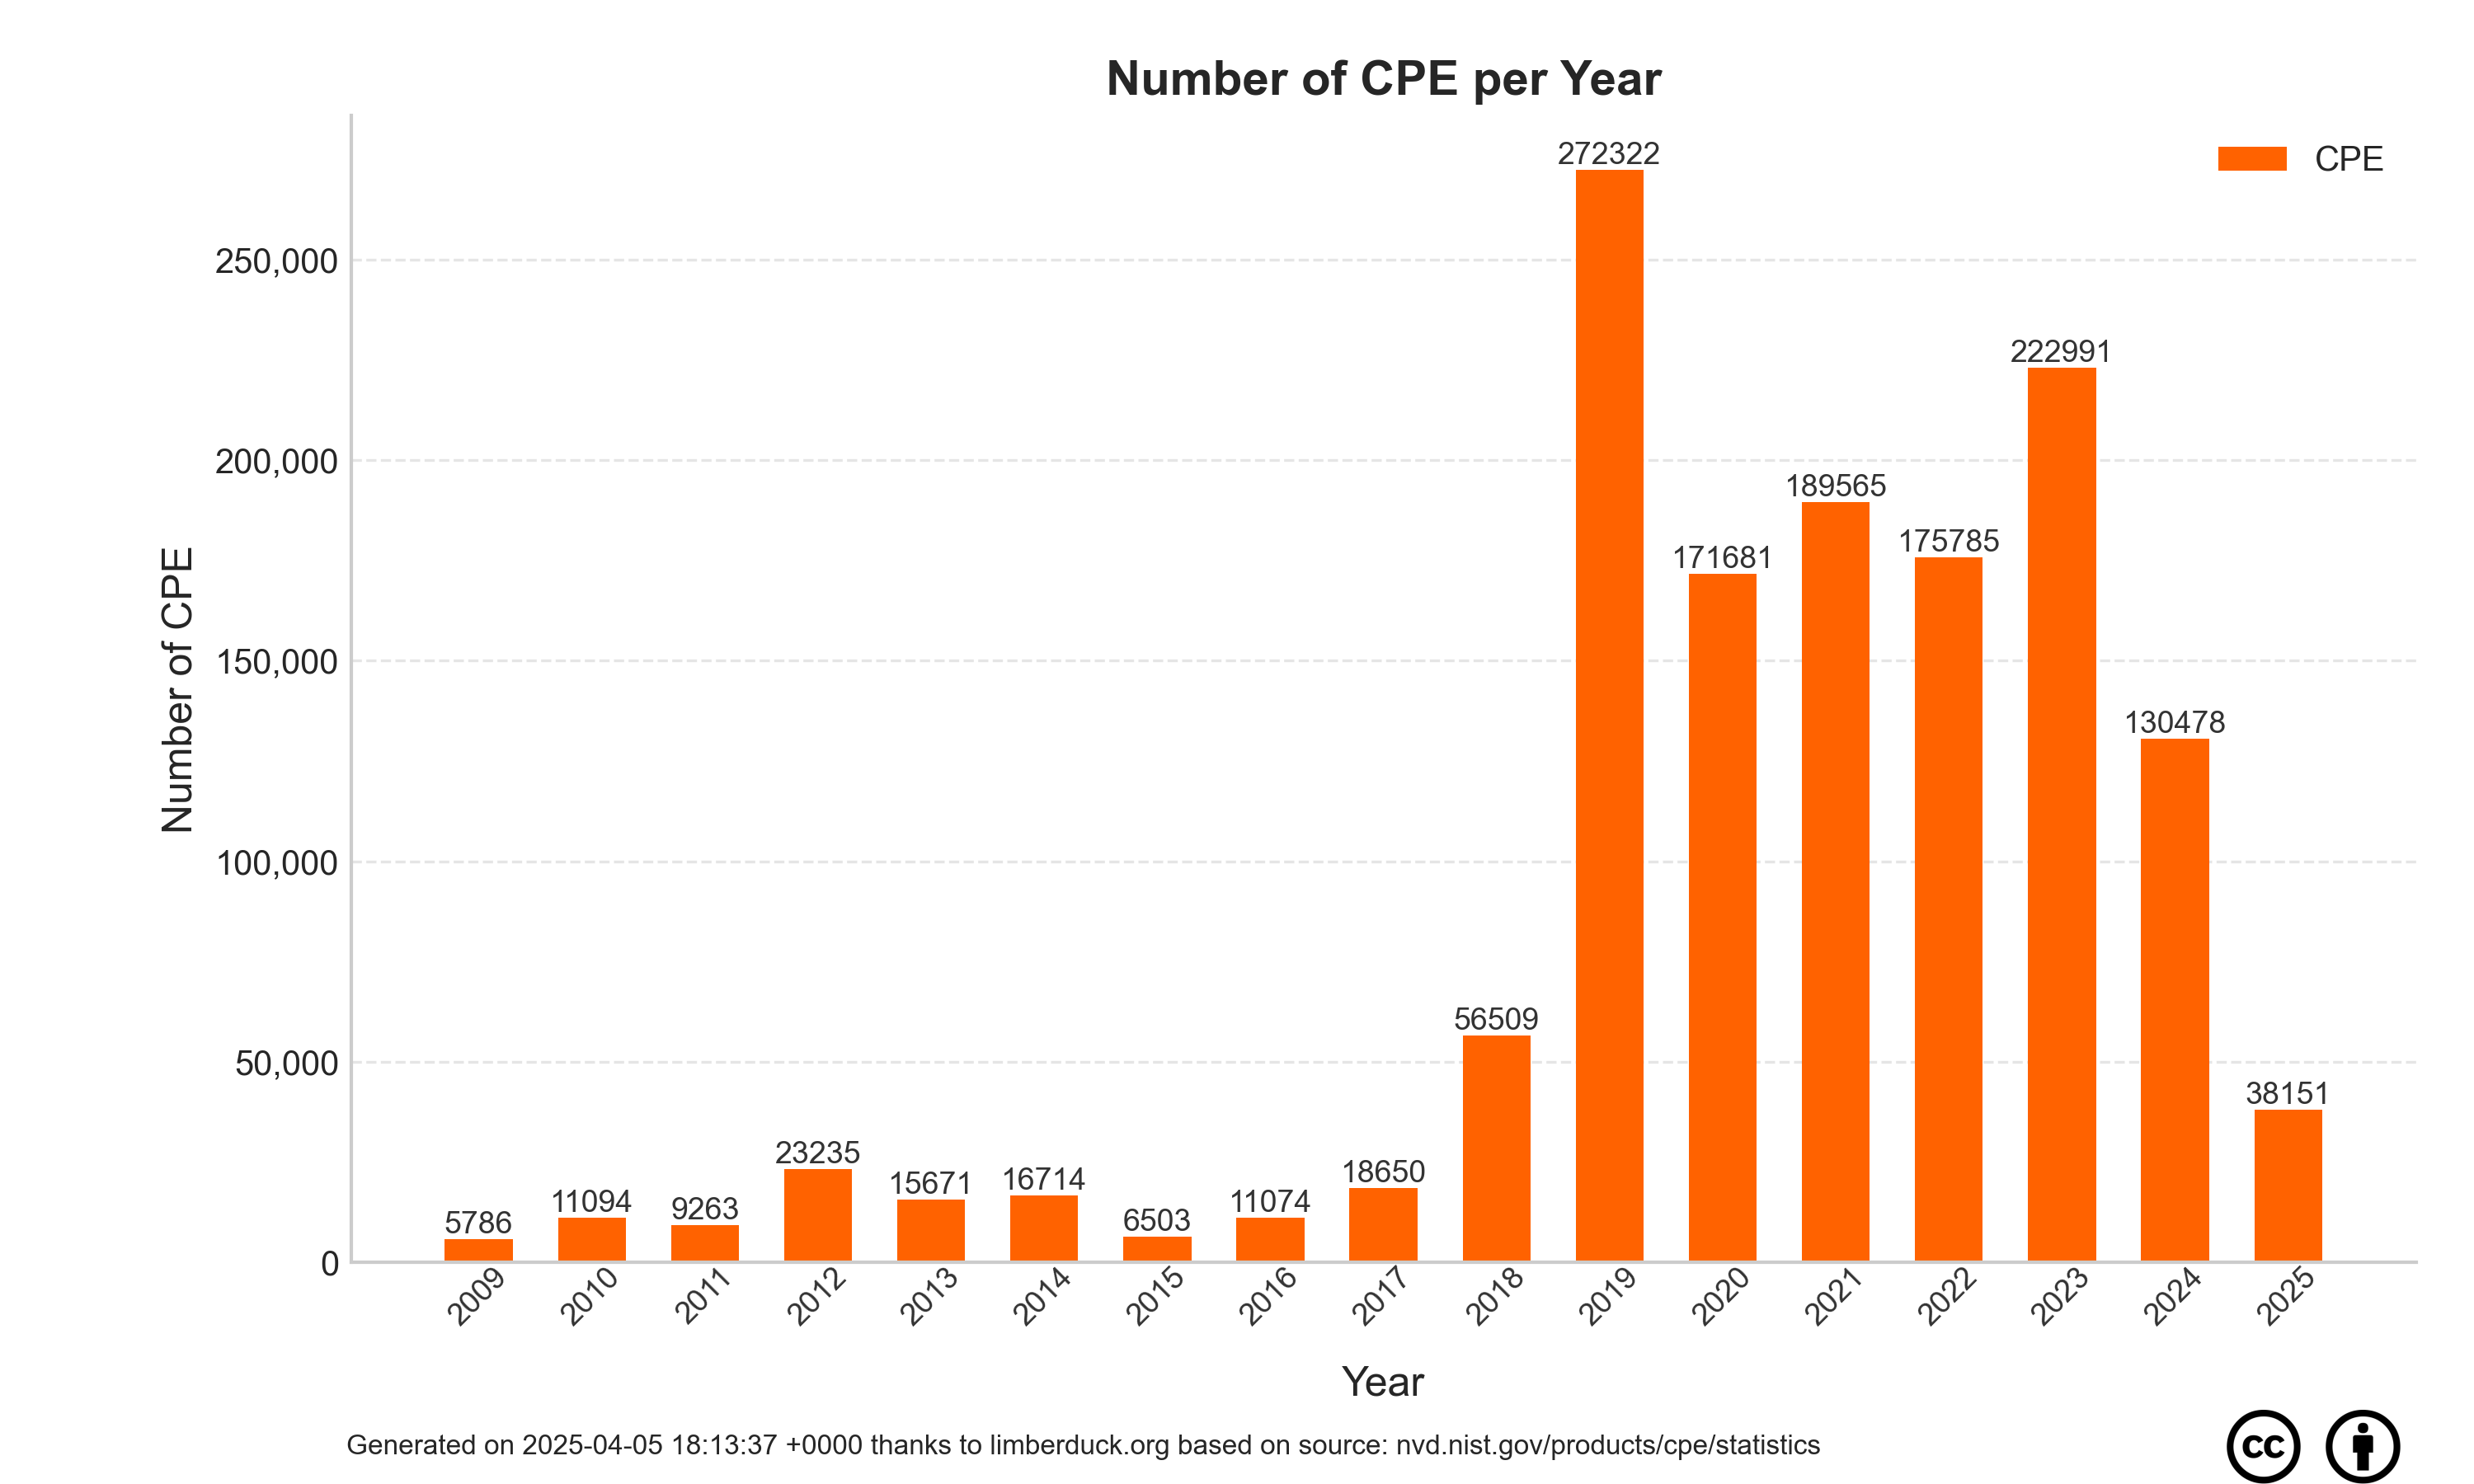
New CPE entries
CPE data parsing
[4]:
import pandas as pd

def pars(data):
    data_table = []

    for table in data:
        table_id = table['id']
        table_year = table_id[-4:]
        table_rows = table.find_all("tr")
        number_of_new_cpe_entries_yearly = 0
        number_of_new_cpe_entries_list = []
        data_row = []
        for table_row in table_rows:
            data = table_row.find_all("td")

            if data:
                number_of_new_cpe_entries = int(data[1].string.replace(",",""))

                number_of_new_cpe_entries_list.append(number_of_new_cpe_entries)

                number_of_new_cpe_entries_yearly += number_of_new_cpe_entries

        while len(number_of_new_cpe_entries_list) < 12:
            number_of_new_cpe_entries_list.append(0)

        data_row.append(table_year)
        data_row.append(number_of_new_cpe_entries_yearly)
        data_row = data_row + number_of_new_cpe_entries_list

        data_table.append(data_row)

    data_columns = ['Year', 'Summary', 'January', 'February', 'March', 'April', 'May', 'June', 'July', 'August', 'September', 'October', 'November', 'December']
    df = pd.DataFrame (data_table, columns = data_columns)
    df.sort_values(by=['Year'], inplace=True)
    df.reset_index(drop=True, inplace=True)
    df.index += 1
    return df

parsed_data = pars(data)

parsed_data.style.bar(subset=['Summary'], color='#FF6200')
[4]:
| Year | Summary | January | February | March | April | May | June | July | August | September | October | November | December | |
|---|---|---|---|---|---|---|---|---|---|---|---|---|---|---|
| 1 | 2009 | 5786 | 181 | 422 | 830 | 639 | 612 | 209 | 241 | 110 | 330 | 102 | 1960 | 150 |
| 2 | 2010 | 11094 | 990 | 234 | 509 | 1106 | 803 | 886 | 426 | 1252 | 707 | 1336 | 1026 | 1819 |
| 3 | 2011 | 9263 | 702 | 925 | 583 | 2252 | 818 | 682 | 430 | 390 | 423 | 470 | 737 | 851 |
| 4 | 2012 | 23235 | 1148 | 1003 | 1622 | 2501 | 3228 | 2259 | 3124 | 2887 | 1583 | 1830 | 1110 | 940 |
| 5 | 2013 | 15671 | 1460 | 1105 | 1138 | 1271 | 932 | 989 | 1623 | 1359 | 1140 | 1941 | 1327 | 1386 |
| 6 | 2014 | 16714 | 1552 | 1151 | 1644 | 2103 | 2175 | 1447 | 1606 | 886 | 885 | 260 | 1380 | 1625 |
| 7 | 2015 | 6503 | 758 | 654 | 849 | 838 | 429 | 736 | 446 | 564 | 81 | 216 | 144 | 788 |
| 8 | 2016 | 11074 | 2450 | 535 | 871 | 699 | 732 | 1471 | 321 | 762 | 979 | 452 | 696 | 1106 |
| 9 | 2017 | 18650 | 746 | 888 | 1070 | 1935 | 1494 | 1210 | 1364 | 1889 | 1516 | 1596 | 2585 | 2357 |
| 10 | 2018 | 56509 | 2273 | 2404 | 1571 | 2525 | 10489 | 5160 | 3707 | 3895 | 3722 | 10862 | 6564 | 3337 |
| 11 | 2019 | 272322 | 6810 | 7197 | 10466 | 12979 | 13181 | 32837 | 45459 | 23763 | 47195 | 26717 | 22731 | 22987 |
| 12 | 2020 | 171681 | 15960 | 18668 | 20159 | 16306 | 14157 | 11250 | 10659 | 14459 | 13077 | 10921 | 9293 | 16772 |
| 13 | 2021 | 189563 | 11253 | 14969 | 18562 | 15476 | 13997 | 18730 | 20791 | 16531 | 14022 | 16164 | 17159 | 11909 |
| 14 | 2022 | 175776 | 11297 | 12125 | 13565 | 10410 | 10261 | 14428 | 13652 | 18251 | 14395 | 15559 | 14888 | 26945 |
| 15 | 2023 | 222949 | 18296 | 16482 | 22053 | 14261 | 17588 | 19858 | 18925 | 20938 | 16826 | 21329 | 18292 | 18101 |
| 16 | 2024 | 130132 | 20233 | 16164 | 2052 | 2926 | 514 | 7636 | 12531 | 12495 | 15996 | 18115 | 14856 | 6614 |
| 17 | 2025 | 193533 | 12540 | 12811 | 10686 | 15989 | 15607 | 15147 | 17688 | 15314 | 21625 | 15091 | 14789 | 26246 |
| 18 | 2026 | 170703 | 34581 | 34974 | 52711 | 41260 | 7177 | 0 | 0 | 0 | 0 | 0 | 0 | 0 |
CPE data saving
CSV file is available in GitHub repository, see:
[5]:
csv_filename = 'cpe-number-of-new-entries.csv'

parsed_data.to_csv(csv_filename, index=False)
CPE data ploting
PNG files are available in GitHub repository with two background versions, see:
[6]:
import pandas as pd
import matplotlib.pyplot as plt
from matplotlib import ticker

df = pd.read_csv(csv_filename)

# Set style and colors
plt.style.use('seaborn-v0_8-whitegrid')
bar_color = '#FF6200'

# Create figure and axes
fig, ax = plt.subplots()

bars = ax.bar(df['Year'], df['Summary'], color=bar_color, width=0.6)

# Add value labels above bars
for bar in bars:
    height = bar.get_height()
    ax.text(bar.get_x() + bar.get_width() / 2,
            height,
            f'{int(height)}',
            ha='center', va='bottom',
            fontsize=9, fontweight='light', color='#333333')

# Disable default x-axis ticks
ax.set_xticks([])

# Add labels below bars
for bar, label in zip(bars, df['Year']):
    ax.text(bar.get_x() + bar.get_width() / 2,
            0,
            str(label),
            ha='center', va='top',
            rotation=45,
            fontsize=9, color='#333333')

# Labels and title
ax.set_xlabel('Year', fontsize=12, labelpad=30)
ax.set_ylabel('Number of CPE', fontsize=12)
ax.set_title('Number of CPE per Year', fontsize=14, fontweight='bold')

# Tweak spines and grid
ax.spines['top'].set_visible(False)
ax.spines['right'].set_visible(False)
ax.grid(axis='y', linestyle='--', alpha=0.5)

# Format Y-axis with thousands separator
ax.yaxis.set_major_formatter(ticker.FuncFormatter(lambda x, _: f'{int(x):,}'))

# Adjust layout for rotated labels
plt.subplots_adjust(bottom=0.15)
plt.tight_layout()

# Legend and footer
plt.legend(['CPE'])
plt.figtext(0.14, 0.02,
            f"Generated on {generation_time} thanks to limberduck.org based on source: nvd.nist.gov/products/cpe/statistics",
            ha="left", fontsize=8)

# Figure background
fig.set_size_inches(10, 6)
fig.patch.set_facecolor('white')

# License icons
img_cc = plt.imread('cc.xlarge.png')
newax_cc = fig.add_axes([0.88, 0.0, 0.05, 0.05], anchor='NE', zorder=-1)
newax_cc.imshow(img_cc)
newax_cc.axis('off')

img_by = plt.imread('by.xlarge.png')
newax_by = fig.add_axes([0.92, 0.0, 0.05, 0.05], anchor='NE', zorder=-1)
newax_by.imshow(img_by)
newax_by.axis('off')

# Save images
plt.savefig('cpe-number-of-new-entries-bg-white.png', dpi=300, facecolor='white')
plt.savefig('cpe-number-of-new-entries-bg-transparent.png', dpi=300, transparent=True)
